ThermoPro reverse engineering 3: A look at the raw data

Summary
The summary part is huge! I've actually figured out a fair amount so far. The "process" part of this post is quite far down.
Going forwards, each blog post will detail what I figure out in that post. A complete set of documentation can be found in my GitHub repo
- The device seems to report all data to the client via notifications.
- It appears that the client requests which data should come in the next notification by writing the RW characteristic.
- All the writes appear to have the form {type, length, optional value, checksum}
- The notifications do not have that format.
- The notification that has data starting with 0x30 appears to be the temperature reports.
Device characteristics summary
As we saw in the last post, there are two primary characteristics being used:
-
The read-write characteristic. (AKA "the RW characteristic" or "handle 0x11")
- UUID:
{1086fff1-3343-4817-8bb2-b32206336ce8} - Descriptor handle: 0x10
- Read/write attribute handle: 0x11
- UUID:
-
The read-notify characteristic. (AKA "the RN characteristic" or "handle 0x13")
- UUID:
{1086fff2-3343-4817-8bb2-b32206336ce8} - Descriptor handle: 0x12
- Read attribute handle: 0x13
- CCC descriptor handle: 0x14 (written to when configuring notifications)
- UUID:
Note that the handles could differ on your device, but it feels unlikely.
Observed data structures
This is split into "commands" - data written to the RW characteristic, and "notifications" - the data sent back from the device via the RN characteristic.
Commands
In this table:
- "Data" refers to the value written into the relevant GATT attribute, including the first byte
- "Command" is the first byte of the Data
- "Typical data" shows a single complete set of data as recorded from my packet trace.
All the written data observed in my traces meets the "TLVC" format described below. Therefore, "Command" is equivalent to the "Type" of the written data.
Rows are ordered the same as how they first appeared in my packet captures.
| Command | Typical data | Comments |
|---|---|---|
| 0x01 | 01097032e2c1799db4d1c7b1 |
First command seen in the trace, and has Command set to 0x01, which is the first non-zero number. Some kind of preamble? |
| 0x26 | 260026 |
Only appears once in the trace. No value, so must be a command. Maybe sets some kind of mode? |
| 0x23 | 23060100ffffffff26 |
Appears 4 times in my trace. Values are from 0x01 - 0x04, so presumably something probe-related? |
| 0x24 | 24010126 |
Appears 6 times in my trace - more than the number of probes. However, see the 0x30 notification comments. Maybe a mode setting command or data-request? |
| 0x41 | 410041 |
Sadly the response to this was not captured. But it only appears once in the trace |
| 0x25 | 250025 |
Only appears once, but the response looks suspiciously similar to the 0x30 command response |
| 0x30 | 300030 |
Appears repeatedly after all other commands. Looks like a 'send temperature' request |
TLVC format
All commands I've observed match the following - a simple "type-length-value-checksum" format.
- Type: 1 byte
- Length: 1 byte. Can be equal to zero.
- Value: exactly "length" bytes long. Omitted if Length is zero.
- Checksum: The mod 256 sum of all preceding bytes.
Notifications
In this table, "Command" is the first byte of the notification data. In all cases, the "Command" value of notified data is the same as that of the command previously written to the RW characteristic.
I have not observed any unsolicited notifications where data was not previously written to handle 0x11.
| Command | Typical data | Comments |
|---|---|---|
| 0x01 | 01010a0ce2c1799db4d1c7b10020c1799db4d1c7 |
There's repetition within this data, and also between this and the command that was sent |
| 0x26 | 26050c0c5a030faf0000071a0020480000200200 |
Kind of incomprehensible right now. |
| 0x23 | 2302010026ffffff260000450200384c0200ffff |
The third byte is always the same as the third command byte. So maybe a probe index? |
| 0x24 | 24060100ffffffff2700ec190020480000200200 |
As above, the third byte looks like a probe index, but it can go up to six... |
| 0x41 | (unknown) | Sadly not yet captured - previous attempt had bad CRC |
| 0x25 | 250e0600ffffffffffff0223ffffffff54200200 |
This has a very similar format to the 0x30 temp data response below... Maybe a starting temperature record? |
| 0x30 | 300f5a0c00ffffffffffff0222ffffffffbf0140 |
Pretty sure this is a periodic temperature report. |
0x30 Temperature reports
Take a typical temperature report as given above. It appears to break down as follows:
- 5 bytes: 300f5a0c00. Preamble. Seems to be fixed for the whole trace. Bytes after the 0x30 differ in other traces found online.
- 12 bytes: 6 temperature reports of 2 bytes each. But the TP-25 only has 4 probes, I don't know how to make the last
two reports be anything other than 0xffff. Encoded as BCD, with the decimal point before the last digit. e.g.
1234decodes to 123.4 degrees Celsius. - 1 byte: In the example notification given above, this is the byte
bf. This appears to be a checksum of the previous bytes, where they're all added together mod 256. - 2 bytes postfix: Always
0x0140for me, and also in this trace
Glorious success! Kind of, anyway
This is the "how I did it" part of the post. Well done for making it this far! Actually the physical steps are quite simple this time.
Having learned to use the sniffer in the previous post, I turned my attention to trying to extract data from the TP25. I started by getting a trace of the actual attribute table.
This was a little fiddly. iOS, and I believe Android, cache the attribute table for a device they've seen before. This means that when the ThermoPro app connects, the whole attribute table isn't transferred over the air each time. It also means it can't be snooped each time!
To work around this, on iOS you simply go into the Settings app and toggle Bluetooth to Off and then back On. Note, it is not sufficient to do this from the pull-down Control Panel on the Home Screen. I assume on Android there's a similar process.
Then I simply started a packet trace, set the sniffer to follow my thermometer, and started the app. Voila, a packet capture with the attribute table in.
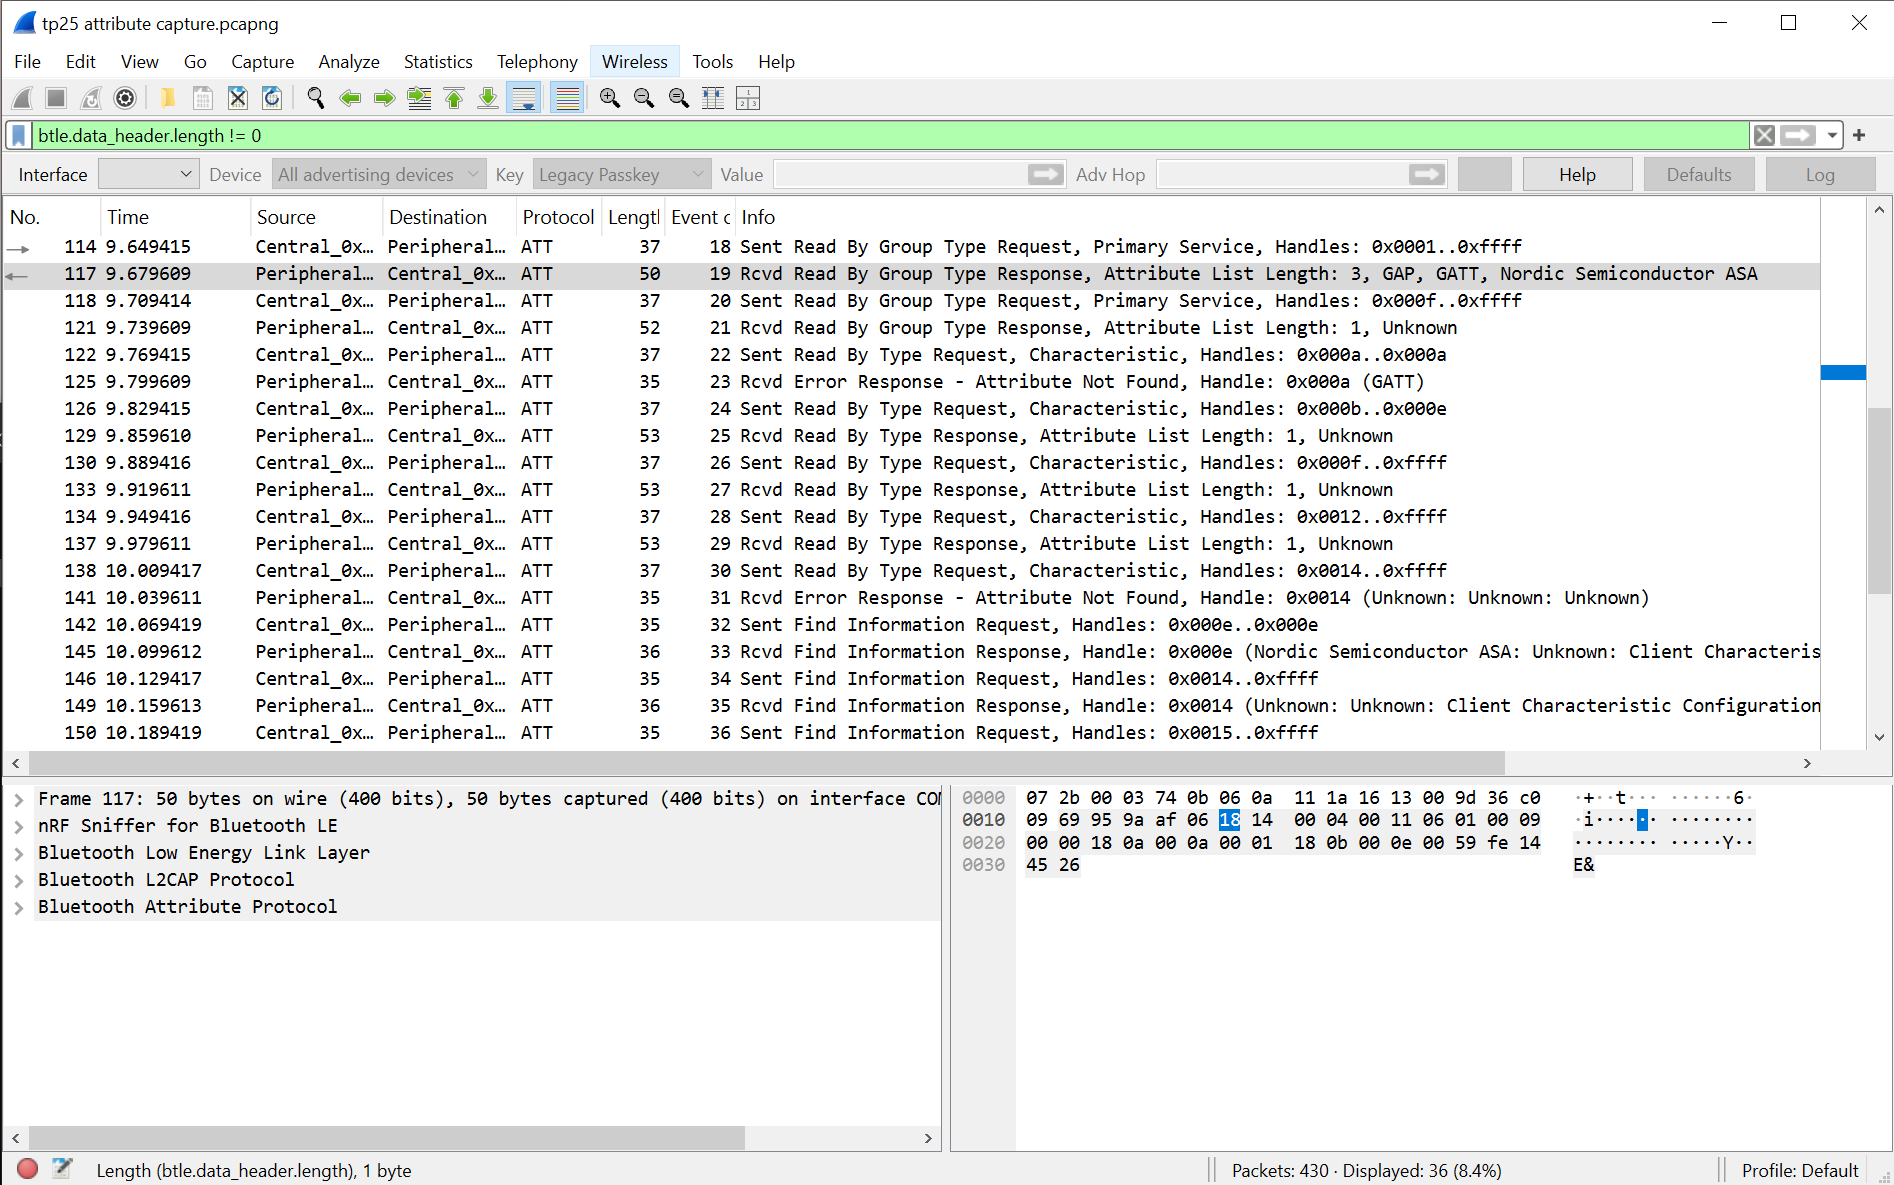
It's a little bit awkward to translate the data sent into a neat attribute table - the Wireshark decoder tries to be helpful by giving you the service UUID, other related handles, and so on, in each packet decode - which makes it a bit hard to "see the wood for the trees". But if you follow it through you can see that the services and characteristics are exactly the same as Bluetooth LE Explorer said they would be. No surprises there. One helpful thing is that you can also see the handles, which is nice for decoding the trace of the device operating normally.
I recommend trying to extract an attribute table from the trace yourself - it really helps solidify the information from the Nordic course.
Having convinced myself there were no "hidden" attributes or advertisements, I recorded a trace of the device operating normally. I started a new capture, selected the thermometer as the device to follow, connected the app, and let the temperature of a probe go up and down. It resulted in a nice trace.
I spent some time going through the capture and extracting the GATT operations. In time order, they were:
| R/W/N | Handle | Data |
|---|---|---|
| Write | 0x14 | 0100 (0x01) - setup notifications from 0x13 |
| Write | 0x11 | 01097032e2c1799db4d1c7b1 |
| Notify | 0x13 | 01010a0ce2c1799db4d1c7b10020c1799db4d1c7 |
| Write | 0x11 | 260026 |
| Notify | 0x13 | 26050c0c5a030faf0000071a0020480000200200 |
| Write | 0x11 | 23060100ffffffff26 |
| Notify | 0x13 | 2302010026ffffff260000450200384c0200ffff |
| Write | 0x11 | 23060200ffffffff27 |
| Notify | 0x13 | 2302020027ffffff270000190020480000200200 |
| Write | 0x11 | 23060300ffffffff28 |
| Notify | 0x13 | 2302030028ffffff280000190020480000200200 |
| Write | 0x11 | 23060400ffffffff29 |
| Notify | 0x13 | 2302040029ffffff290000190020480000200200 |
| Write | 0x11 | 24010126 |
| Notify | 0x13 | 24060100ffffffff2700ec190020480000200200 |
| Write | 0x11 | 24010227 |
| Notify | 0x13 | 24060200ffffffff2800001a0020480000200200 |
| Write | 0x11 | 24010328 |
| Notify | 0x13 | 24060300ffffffff2900141a0020480000200200 |
| Write | 0x11 | 24010429 |
| Notify | 0x13 | 24060400ffffffff2a00281a0020480000200200 |
| Write | 0x11 | 2401052a |
| Notify | 0x13 | 24060500ffffffff2b00a1190020480000200200 |
| Write | 0x11 | 2401062b |
| Notify | 0x13 | 24060600ffffffff2c00b5190020480000200200 |
| Write | 0x11 | 410041 |
| Bad CRC - miscaptured notify? | ||
| Write | 0x11 | 250025 |
| Notify | 0x13 | 250e0600ffffffffffff0223ffffffff54200200 |
| No initial 0x30 command here? | ||
| Notify | 0x13 | 300f5a0c00ffffffffffff0222ffffffffbf0140 |
| Write | 0x11 | 300030 |
| Notify | 0x13 | 300f5a0c00ffffffffffff0233ffffffffd00140 |
| Write | 0x11 | 300030 |
| A connection params update happened here | ||
| Notify | 0x13 | 300f5a0c00ffffffffffff0258fffffffff50140 |
| Write | 0x11 | 300030 |
| Notify | 0x13 | 300f5a0c00ffffffffffff0281ffffffff1e0140 |
| Write | 0x11 | 300030 |
| Notify | 0x13 | 300f5a0c00ffffffffffff0297ffffffff340140 |
| Write | 0x11 | 300030 |
| Notify | 0x13 | 300f5a0c00ffffffffffff0310ffffffffae0140 |
| Write | 0x11 | 300030 |
| Notify | 0x13 | 300f5a0c00ffffffffffff0325ffffffffc30140 |
| Write | 0x11 | 300030 |
| Notify | 0x13 | 300f5a0c00ffffffffffff0309ffffffffa70140 |
| Write | 0x11 | 300030 |
| Notify | 0x13 | 300f5a0c00ffffffffffff0293ffffffff300140 |
| Write | 0x11 | 300030 |
| Notify | 0x13 | 300f5a0c00ffffffffffff0281ffffffff1e0140 |
Immediately I can see that the 0x30 command and response are associated with the temperature - the variable bit changes to match the temperature on the device's screen. Since I can read it in the hex, it looks like a BCD format, as described above.
I'm curious about the 3rd-last byte of the 0x30 responses. (e.g. 0x1e in the last row of the table). A quick check with the calculator convinces me this is the checksum of all previous bytes. I'm baffled why there's an apparently constant suffix of 0x0140 though.
Also, assuming I'm right about the temperature reports being 2 bytes long (which, in BCD allows temperatures up to 999.9C or some way of coding negatives) then it's not clear why there's space for 6 reports.
That's the easy bits checked off. Probably at this point I could see if I could provoke the thermometer into giving
temperature notifications by issuing the command 300030 but I'm not feeling like playing with it, so I keep looking
for patterns.
The 0x25 command and response is interesting - it has a very similar format to the 0x30 ones. Indeed, the bit that looks like a temperature is what I'd expect the temperature to have been at that point. I can see it's shifted slightly relative to the 0x30 responses. I wonder if it's a starting temperature notification? But why bother with one of those?
0x01 comes first in the connection, and also has the lowest command byte value (assuming that zero is invalid!) So I guess it's some kind of "welcome" message. Curious amount of repetition in both the command and response.
0x26 provokes a response but sends no data in the command. So maybe it's a "turn on" type command, or it's asked for some kind of status.
0x23 appears 4 times. Also, the third byte ranges from 1 to 4. This makes me think it's a per-probe command. Curious that it both sends and receives data, and that they're of different lengths.
0x24 is even more of a mystery because it occurs 6 times, and the third byte ranges from 1 to 6. So it's presumably not per-probe, but I can't think what else it could be. I see that the 0x30 response seem to have space for 6 reports - maybe this is related?
And with that, I'm out of thoughts for the time being. That's probably enough for now anyway. I haven't explored any of the other functionality (e.g. alarms) yet.
Conclusions
- It really looks as though we can see temperatures being sent from the device 🥳
- Next steps are
- Try and see if I can manually get 0x30 reports to be sent (maybe in BLE Explorer, maybe by writing a script)
- Record more captures, ideally whilst exercising the alarms functionality, Fahrenheit mode, etc.